
2017 Annual Statistics
Every week the site sends us an email containing map usage data. The email lists things like:
- the quantities of new machine comments
- machines removed
- machines added
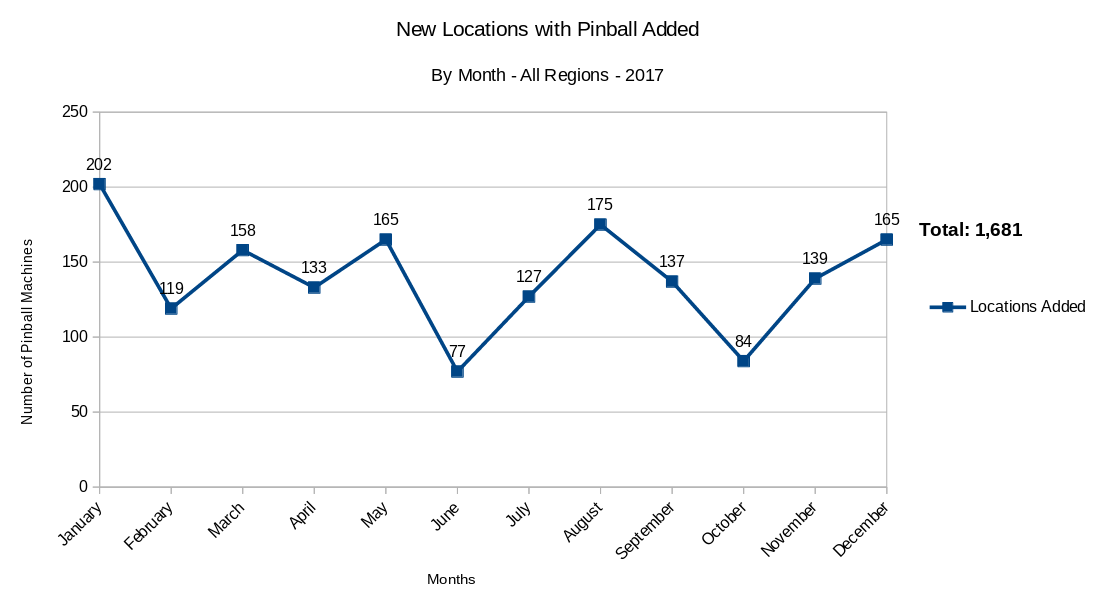
- locations added
- events listed
- submitted locations that haven’t been added
- locations that no longer list machines
- etc.
This weekly email helps us track usage and pending operations. And it helps local administrators see an overview of the action in their neck of the woods.
For this Annual Stats post, we’ve compiled this weekly data into annual data. We just thought it would be fun to share some charts showing usage, trends, and whatnot. Since there are over 90 regions on the site, it would be too much work to show you charts for every region. But if you’re interested in seeing a particular set of data applied to your region, let us know and we’ll gladly do it.
Caveats: This should be considered anecdotal data. For one, we’re missing three weeks of these weekly emails (two in June and one in October - notice how the values dip in those months?). So the overall numbers are not accurate. But given the scale we’re working with, they’re close enough.
Locations Added: 1,681!
Machines Added and Removed
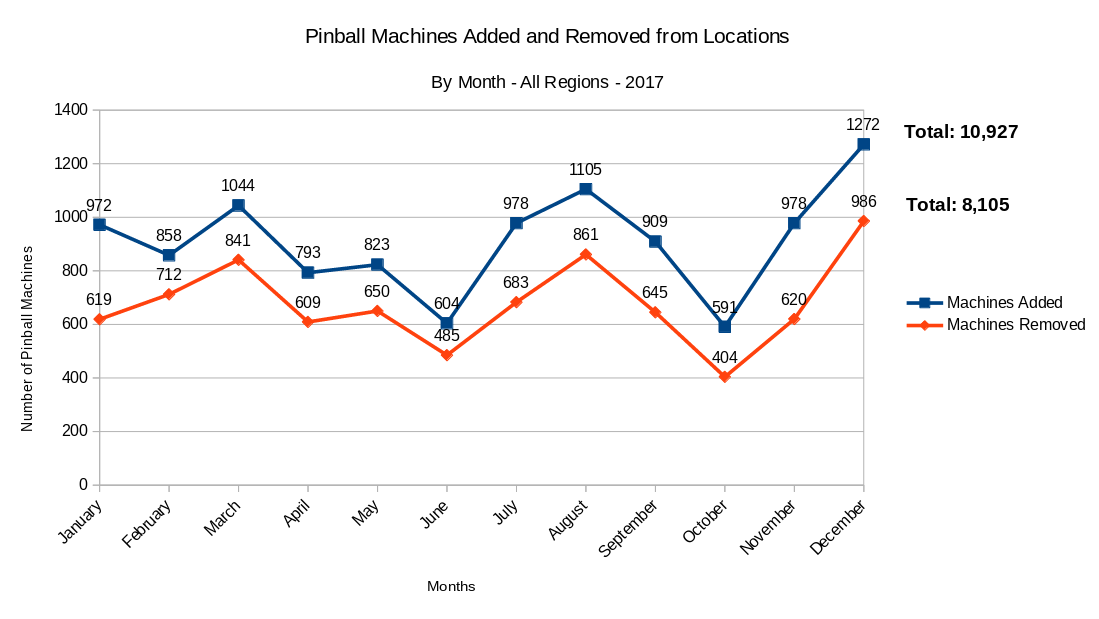
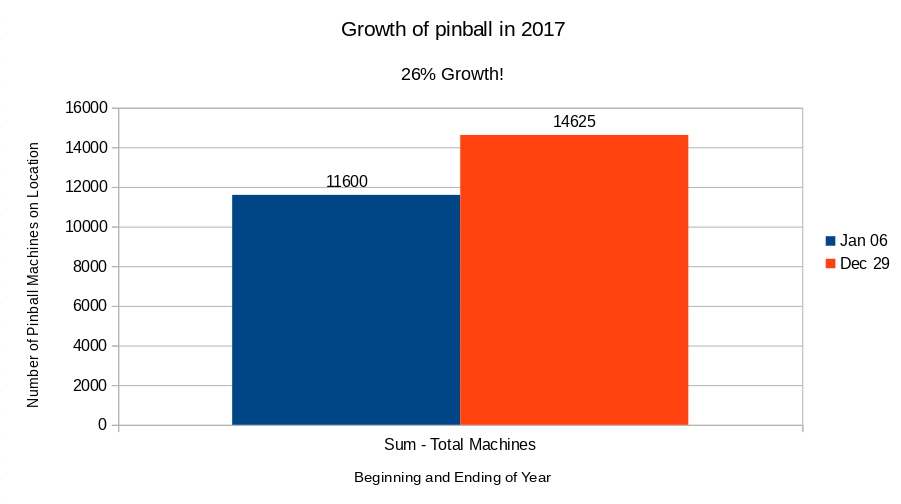
Since, as you saw above, machines are both added and removed, the next chart shows the net increase in machines.
Net increase in machines listed: 26% Growth!
We didn’t make the same chart for net increase in locations. But we can!
Next year we’ll show number of comments left on machines (we didn’t add that to the weekly emails until midway through 2017).
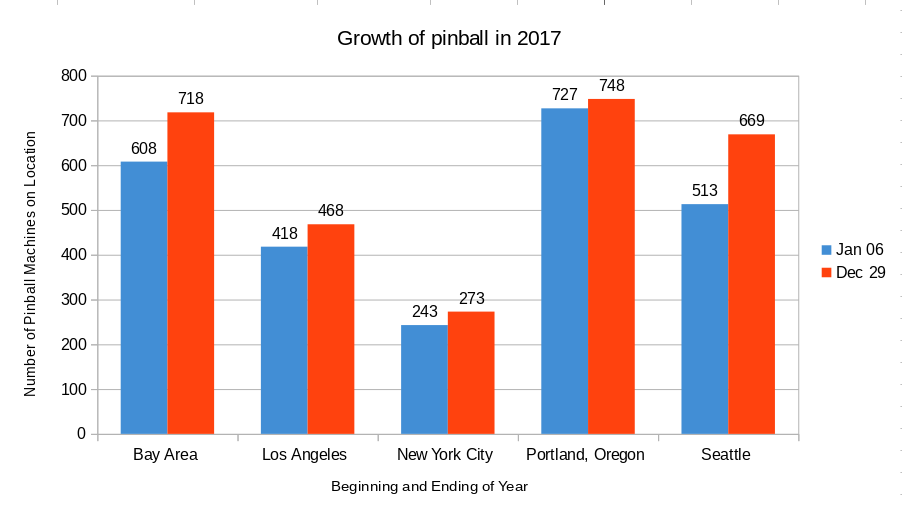
And here’s a bonus chart showing growth in a few select cities.
Happy New Year!